
Star colors directly reveal temperature: blue stars burn hottest (30,000-60,000K), while red stars are coolest (below 3,500K). The OBAFGKM sequence (Oh Be A Fine Girl/Guy, Kiss Me) helps you remember star types from hottest to coolest. Interstellar dust can make stars appear redder than they actually are, requiring astronomical corrections. Temperature also indicates a star’s life stage—blue stars are typically young, while red giants represent later evolutionary phases. These cosmic thermometers unveil deeper stellar secrets.
Star Colors: 10 Tips About Heat & Type
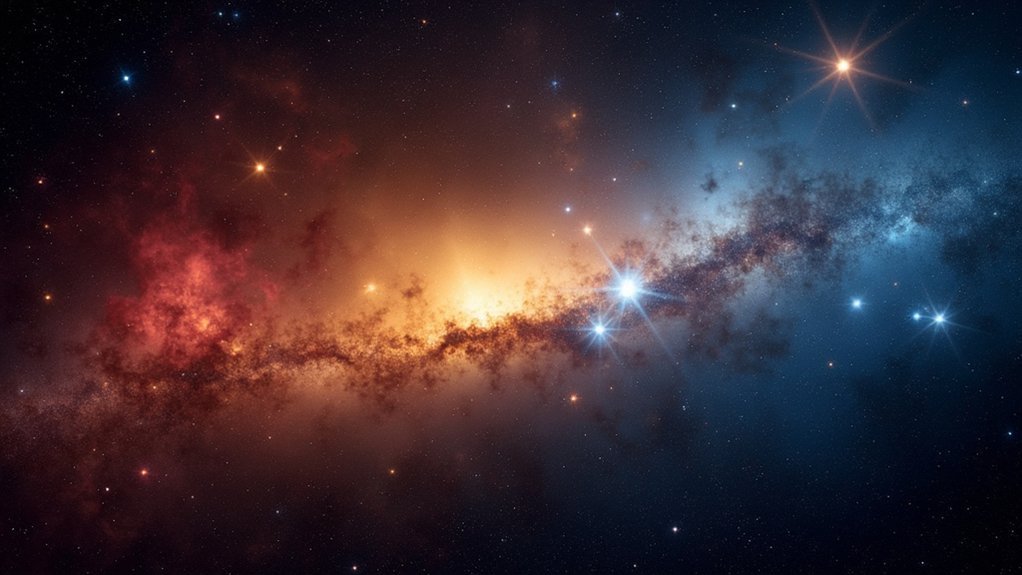
The fascinating world of stellar colors reveals essential information about a star’s temperature and classification. When you see a bluish star, you’re observing one of the hottest celestial bodies, often exceeding 10,000 K, while reddish stars indicate cooler temperatures below 5,000 K.
Astronomers use the B-V color index to precisely measure these temperature differences. You’ll find that O-type stars burn the hottest at around 60,000 K, appearing blue, while M-type stars glow red at approximately 3,000 K.
Tools like photometry with UBV filters help scientists analyze these properties. Wien’s Law explains why hotter stars emit more blue light – their spectral peaks shift toward shorter wavelengths as temperatures rise. This relationship is fundamental for understanding stellar lifecycles and evolution patterns.
When studying star colors, remember that interstellar dust can affect observations, requiring careful corrections.
Why Blue Stars Burn Hottest in Our Universe
While gazing at the night sky, you’ll notice that blue stars outshine their stellar counterparts with a distinctive azure glow, revealing their extreme temperatures that can reach an astonishing 50,000 K.
These celestial powerhouses consume hydrogen fuel at extraordinary rates, leading to their brief lifespans of just a few million years compared to cooler stars. You’re witnessing cosmic sprinters rather than marathoners.
Blue stars burn intensely but briefly—cosmic fireworks that dazzle for moments rather than eternities.
Blue stars emit primarily ultraviolet radiation and shorter wavelengths, explaining their intense blue appearance. When you observe stars like Rigel or Spica, you’re seeing O or B-type stars in action. For optimal viewing, seek locations away from light pollution which significantly diminishes your ability to distinguish star colors.
Their presence in galaxies signals recent star formation activity. Despite being challenging to observe through interstellar dust, these astronomical marvels provide critical insights into early universe conditions and galactic evolution.
The OBAFGKM Sequence: Decoding Stellar Categories
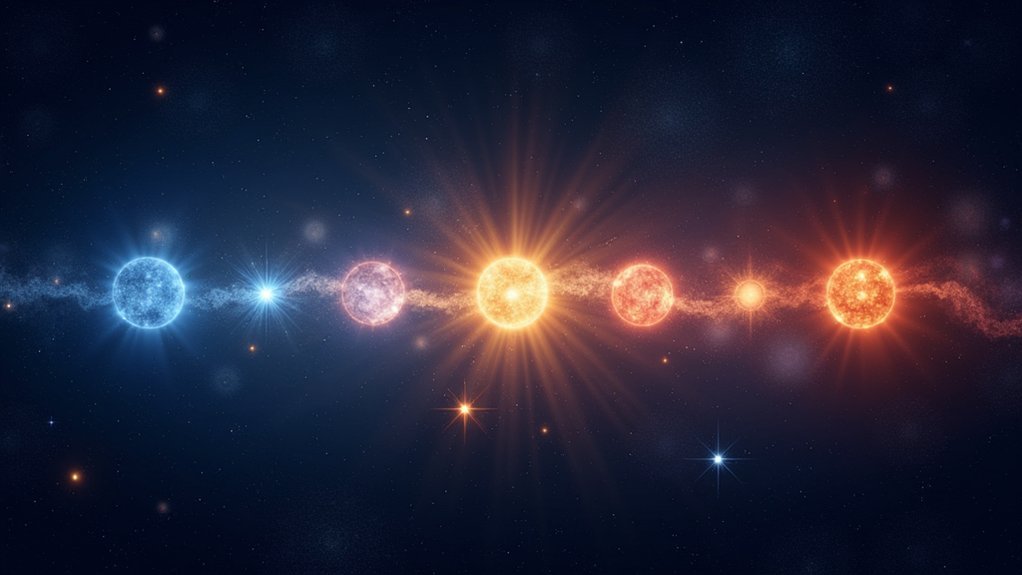
Commonly recalled through the mnemonic “Oh Be A Fine Girl/Guy, Kiss Me,” the OBAFGKM sequence represents a fundamental classification system astronomers use to categorize stars based on their temperature and spectral characteristics. This sequence orders stars from hottest to coolest, with each letter indicating specific temperature ranges and color properties.
| Spectral Type | Temperature (K) | Color |
|---|---|---|
| O & B | 10,000-50,000 | Blue |
| A & F | 6,000-10,000 | White |
| G, K & M | <6,000 | Yellow to Red |
Each spectral type divides further into subtypes (0-9), providing greater precision. For example, our Sun is a G2V star—a yellow main sequence star. The “V” in the classification represents the luminosity class V, indicating that our Sun is a main sequence dwarf star rather than a giant or supergiant. The system, developed by Harvard Observatory’s female astronomers, particularly Annie Jump Cannon, remains fundamental to modern astrophysics.
How to Estimate a Star’s Temperature Just by Looking
Ever wondered if you can determine a star’s temperature simply by observing it with your naked eye? The color you see provides a reliable clue.
Blue stars like Rigel burn hottest (30,000-60,000 K), while reddish stars like Betelgeuse are cooler (around 3,000 K).
This relationship follows Wien’s Law, where peak wavelength shifts inversely with temperature. As stars get hotter, their peak emission moves toward shorter, bluer wavelengths.
White stars fall in the middle temperature range. These stars also fall into specific categories on the Main Sequence classification from O, B, A, F, G, K, to M types.
Remember that Earth’s atmosphere can distort colors, making precise estimation challenging. For more accuracy, astronomers use color indices (comparing blue and visual filters) and spectral analysis.
While your eyes won’t give you exact Kelvin readings, they’ll help you distinguish between scorching blue giants and cooler red dwarfs.
Our Yellow Sun: A Medium-Temperature Star Explained
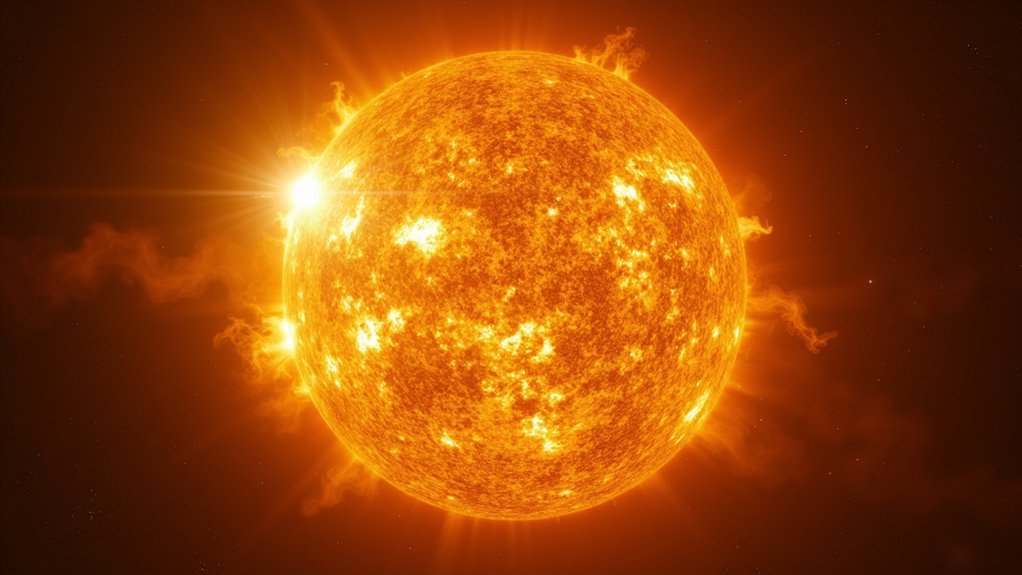
Sitting at the center of our solar system, our Sun represents the perfect example of a yellow dwarf star—though its apparent color might surprise you. While we perceive it as yellow, our Sun is actually white, with Earth’s atmosphere creating its yellowish appearance.
Classified as a G-type main-sequence star (G-V), our Sun maintains a surface temperature of about 5,700 K.
It’s a remarkably stable energy producer, converting hydrogen to helium through nuclear fusion in its core. This process will continue for roughly 10 billion years total, with about 5 billion years already behind us. When the Sun exhausts its hydrogen fuel, it will expand into a red giant phase before eventually becoming a white dwarf.
The Sun’s moderate temperature and consistent energy output create ideal conditions for life, making yellow dwarfs like ours particularly important in the search for habitable worlds.
Red Giants vs. Red Dwarfs: Temperature Differences That Matter
Despite sharing a similar color designation, red giants and red dwarfs represent dramatically different phases in stellar evolution with critical temperature distinctions.
You’ll find red giants have surface temperatures between 3,000-5,000 K, appearing more orange than their dwarf counterparts. These enormous stars can be hundreds of times larger than our sun and thousands of times more luminous, making them visible to the naked eye despite their cooler surfaces.
Red dwarfs, meanwhile, maintain temperatures of 2,000-3,900 K and appear distinctly redder. Unlike giants, these small stars feature consistent internal temperatures due to full convection. Red dwarfs are positioned below the main sequence on the Hertzsprung-Russell diagram, indicating their unique evolutionary status.
Red dwarfs run cooler at 2,000-3,900 K, appearing truly red with remarkably uniform internal temperatures through complete convection.
The most striking difference? Temperature gradient. A red giant’s core reaches tens of millions of degrees while its surface remains cool.
Red dwarfs lack this dramatic contrast, contributing to their remarkable stability and trillion-year lifespans.
Using Color Indexes to Measure Stellar Heat Precisely
While visible color gives us a general sense of stellar temperature, astronomers need more precise methods to quantify a star’s heat. This is where color indexes come in—measuring the difference in a star’s brightness through different wavelength filters.
The most common index, B–V, compares blue and visual light emissions, typically ranging from -0.4 (hot stars at 40,000K) to +2.0 (cool stars at 2,000K). If you’re working with mid-temperature stars, B–V works well, while cooler stars benefit from R–I measurements.
Remember that Vega serves as a reference point with a B–V of 0, corresponding to about 10,000K.
Unlike brightness, color indexes don’t change with distance, making them reliable temperature indicators regardless of how far away a star is. The color index uses a logarithmic magnitude scale to effectively compare the brightness between different wavelengths.
How Interstellar Dust Affects Our Perception of Star Colors
When you observe stars through space, interstellar dust particles scatter and absorb blue light more efficiently than red, making distant stars appear redder than they truly are.
This dust reddening can greatly alter your perception of a star’s temperature and type, potentially causing you to misclassify hot stars as cooler ones.
You’ll need to apply color index corrections like E(B-V) measurements to account for this dust effect and determine a star’s actual temperature classification. The level of reddening experienced by starlight is inversely proportional to the wavelength of the light traveling through the interstellar medium.
Dust Reddening Effects
As starlight travels through our galaxy, interstellar dust particles greatly alter our perception of star colors. These tiny grains—comparable in size to the wavelength of blue light—scatter and absorb shorter wavelengths more effectively than longer ones.
When you observe stars, you’re seeing this “reddening” effect in action. The dust doesn’t actually add red light; rather, it selectively removes blue light from the spectrum. This makes distant stars appear redder and dimmer than they truly are. This process is similar to how smoke scatters light, creating the reddish sunsets we observe through atmospheric haze on Earth.
Without accounting for this effect, you might misinterpret a star’s temperature based on its color. In extreme cases, stars become completely invisible in visible wavelengths and can only be detected through infrared observations.
The reddening varies depending on how much dust lies between you and the star.
Correcting Color Observations
To properly interpret the true colors and temperatures of stars, astronomers must account for the reddening effects of interstellar dust.
When you observe stars, you’re not seeing their true appearance—dust particles between you and the star absorb and scatter blue light more than red, making stars appear redder and dimmer.
Astronomers correct for this using color indices like B-V, calculating the color excess through E(B-V) = (B-V) – (B-V)₀.
This excess measures how much dust has reddened the star. The extinction (dimming) is related by A_V = 3.2E(B-V).
You’ll find this correction essential when studying distant stellar populations.
Without adjusting for dust, you might misinterpret a hot blue star as cooler, or miscalculate its distance and luminosity. The temperature range of stars spans from over 40,000 K for the hottest blue stars to about 2000 K for the coolest red ones.
The Physics Behind Wien’s Law and Star Appearance
When you look at stars of different colors, you’re witnessing Wien’s displacement law in action, where hotter stars emit peak radiation at shorter wavelengths (appearing blue), while cooler stars emit peak at longer wavelengths (appearing red).
The mathematical relationship λ(max) = b/T shows that peak wavelength and temperature are inversely related, explaining why Spica at 25,000K appears blue while Betelgeuse at 3,500K glows red.
You can use this principle to estimate a star’s temperature based on its color, as this relationship remains consistent regardless of the star’s distance from Earth. Astronomers commonly use the B-V color index to quantify these temperature differences more precisely than visual observation alone.
Radiation Peaks Determine Colors
The physics of star colors can be directly traced to Wien’s displacement law, which establishes the relationship between a star’s surface temperature and the wavelength at which it emits the most radiation.
Stars fundamentally function as blackbodies, with their peak emission determining the dominant color you’ll observe.
When examining stars, remember:
- Hotter stars (30,000K+) emit peak radiation at shorter wavelengths, appearing blue or blue-white.
- Intermediate stars (5,000-10,000K) have peak emissions in yellow-white portions of the spectrum.
- Cooler stars (3,000K) peak in the infrared range, appearing distinctly red.
This temperature-color relationship forms the foundation of stellar classification.
While interstellar dust can redden a star’s appearance, it doesn’t change its intrinsic temperature—astronomers use color indices like B-V to quantitatively measure these temperature differences.
The Hertzsprung-Russell diagram helps astronomers visualize this relationship by plotting stars according to their temperature and luminosity.
Wavelength-Temperature Inverse Relationship
Underlying the distinctive colors we observe in stars is Wien’s Displacement Law, which establishes a fundamental inverse relationship between temperature and wavelength. As a star’s temperature increases, its peak radiation shifts toward shorter wavelengths, expressed mathematically as λₘₐₓ = b/T, where b is Wien’s constant (2.898×10⁻³ m·K).
This explains why hotter stars appear blue or white while cooler stars show red or yellow hues. When you’re gazing at the night sky, you’re actually seeing a temperature spectrum: blue stars can exceed 30,000K, while red stars might hover around 3,000K. Astronomers have developed a system to classify stars into spectral types based on these temperature differences.
Though stars aren’t perfect black bodies due to atmospheric absorption lines, Wien’s Law provides a reliable framework for understanding how temperature determines a star’s color—essentially giving you a temperature gauge millions of light-years away.
Temperature Clues That Reveal a Star’s Life Stage
Throughout a star’s lifetime, its temperature provides fundamental clues about its current evolutionary stage. When observing stars, you’ll notice their colors directly correspond to their life phases and internal processes.
- Blue-white stars are typically young main sequence stars with core temperatures exceeding 1 million Kelvin, actively fusing hydrogen and burning hot and bright due to their mass.
- Yellow stars like our Sun represent middle-aged main sequence stars with stable hydrogen fusion and balanced gravitational forces. During this stage, the outward energy from fusion counteracts the gravitational pull, creating stability that can last billions of years.
- Red giants signal a star’s later life stage where the core has depleted its hydrogen, contracted and heated further, causing outer layers to expand and cool, changing the star’s color to red.
You can fundamentally read a star’s life story by carefully interpreting its temperature-based color signals.
Frequently Asked Questions
Can Binary Stars Have Dramatically Different Colors?
Yes, you’ll see dramatic color differences in binary stars due to their different temperatures. When you observe systems like Albireo, you’ll notice striking gold and blue contrasts resulting from their distinct spectral classifications.
Do Stars Change Color During a Single Night’s Observation?
You won’t see stars change their true color during a single night’s observation. Any color variations you notice are due to atmospheric effects like scintillation (twinkling) rather than actual temperature changes in the star.
How Do Variable Stars’ Temperatures Fluctuate With Brightness Changes?
When variable stars brighten, you’ll observe rising temperatures as they contract, becoming hotter and bluer. As they dim, they’re expanding, cooling down, and shifting redder. This temperature-brightness relationship follows stellar pulsation cycles.
Can We Determine Temperature of Stars Invisible to Naked Eye?
Yes, you can determine invisible stars’ temperatures using spectroscopy, which analyzes their light spectrum. Astronomers also apply Wien’s Law and measure color indices using telescopes to calculate temperatures of stars you can’t see.
How Do Exoplanet Atmospheres Affect Our Perception of Host Stars?
Exoplanet atmospheres can filter and alter the starlight you observe, potentially masking stellar features. When planets transit, their atmospheric composition can absorb specific wavelengths, affecting how you perceive the host star’s spectral characteristics.
In Summary
You’ve now seen how star colors tell a remarkable story about temperature and stellar types. When you’re stargazing, remember that blue giants burn hottest while red stars keep cooler. The OBAFGKM sequence isn’t just classification—it’s a temperature roadmap across our universe. Next time you look up, you’ll understand why stars shine with different hues and what those colors reveal about their fiery nature.


Leave a Reply