
The Harvard Star Classification system revolutionized astronomy by organizing stars based on temperature (OBAFGKM sequence) and luminosity. You’ll find it essential for understanding stellar evolution, composition, and physical properties. The system helps astronomers map relationships between stars on the Hertzsprung-Russell Diagram, revealing their life cycles from birth to death. This fundamental framework continues evolving with new discoveries, adding classes for brown dwarfs and other celestial objects. Explore this cosmic catalog to unveil the universe’s stellar secrets.
The Origins of the Harvard Classification System
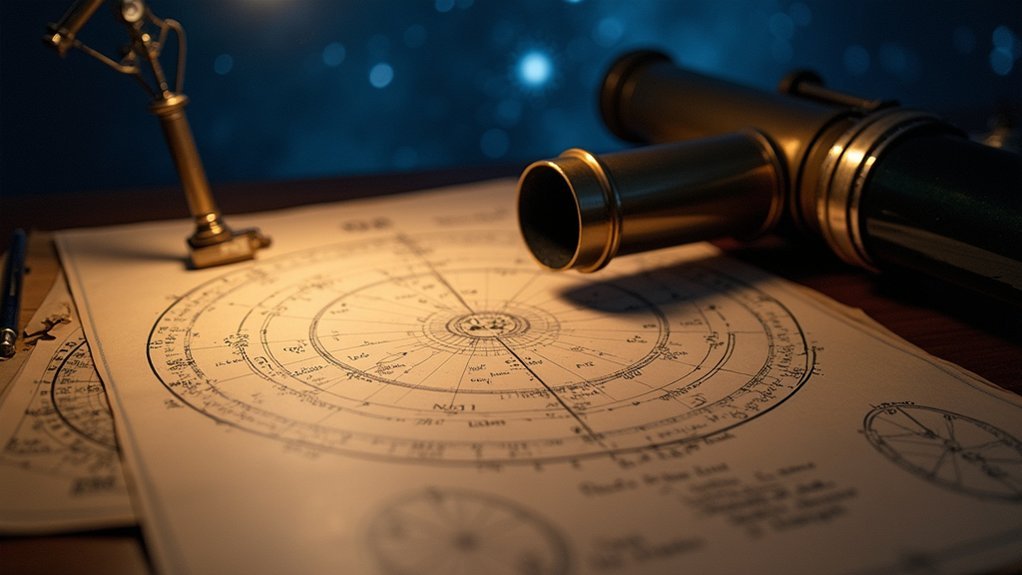
While stars have captivated humanity for millennia, our scientific understanding of them began to crystallize in the 1860s with Angelo Secchi’s pioneering work. Secchi established four basic spectral types that served as the foundation upon which the Harvard classification scheme would later build.
In the late 1890s, astronomers refined Secchi’s work as they gained deeper insights into stellar spectra. Annie Jump Cannon revolutionized this process by methodically categorizing over 350,000 stars and creating a one-dimensional system using letters to designate spectral types.
Her approach organized stars according to their surface temperatures, arranging them from hottest (O-type) to coolest (M-type). This elegant classification became essential to understanding stellar evolution, as it revealed how stars’ properties relate to their temperatures and compositions throughout their lifecycles.
Decoding the OBAFGKM Sequence and Its Significance
The mnemonic “Oh Be A Fine Girl/Guy, Kiss Me” serves as a helpful memory aid for the Harvard spectral classification system‘s sequence of OBAFGKM. This powerful classification system organizes stars primarily by temperature, with O-type stars blazing at 25,000-50,000 K and M-type stars glowing below 3,500 K.
When you observe the night sky, you’re witnessing this sequence in action through stellar color and brightness. Blue, luminous O and B stars contrast dramatically with the yellow and red hues of G and M stars like our Sun.
Each spectral class divides further into numbered subclasses (0-9), providing precise temperature gradations. This framework isn’t just taxonomic—it’s fundamental to understanding stellar evolution.
Temperature, Color, and Spectral Line Relationships
Stars reveal their secrets through their spectral absorption patterns, where O-type stars show strong ionization lines while M-type stars display molecular bands like titanium oxide.
You’ll notice a direct correlation between a star’s color and its temperature, with the hottest stars appearing blue and the coolest appearing red.
These temperature-dependent characteristics allow astronomers to classify stars systematically, connecting visible attributes to the fundamental physical properties driving stellar behavior.
Spectral Absorption Patterns
Understanding spectral absorption patterns reveals the fundamental relationship between a star’s temperature, color, and chemical makeup.
When you examine a star’s spectrum, you’ll notice distinctive absorption lines that directly correlate with its temperature range. Hotter O-type stars display strong ionized helium lines, while cooler M-type stars show molecular bands.
These absorption patterns aren’t merely descriptive—they’re powerful diagnostic tools. The Harvard classification organizes stars from hot to cool (O, B, A, F, G, K, M), with each spectral type subdivided into ten precise subcategories.
This detailed categorization helps you identify where a star fits in its evolutionary journey.
Color-Temperature Correlation
Within the Harvard classification system, a star’s temperature directly determines its visible color, creating a predictable correlation that astronomers use for rapid identification. You can observe this color-temperature correlation as you move through spectral classes: O and B stars (the hottest) appear bluish-white, while cooler stars in the K and M classes show distinctly reddish hues.
The temperature of the photosphere influences which chemical elements produce absorption lines in a star’s spectrum. Hotter stars (O-type) exhibit strong ionized helium lines, while cooler stars (M-type) reveal complex molecules like titanium oxide.
Each spectral type, subdivided into numbered subcategories (0-9), offers precise temperature differentiation. The Harvard star classification consequently provides a fundamental framework for understanding stellar evolution, allowing you to interpret a star’s lifecycle and composition based on observable characteristics.
The Role of Luminosity Classes in Stellar Classification
You’ll find stars arranged in a brightness hierarchy through luminosity classes, which extend from faint main sequence stars (class V) to brilliant supergiants (class I).
These classifications, denoted by Roman numerals, help astronomers determine a star’s evolutionary stage and physical properties beyond just its temperature.
Our Sun, a G2 V star, represents a common main sequence star, while more massive stars evolve through different luminosity classes as they age, expanding into giants and potentially supergiants before reaching their end stages.
Stellar Brightness Hierarchy
While spectral types tell us about a star’s temperature and color, luminosity classes reveal vital information about its brightness and evolutionary stage.
Within the Harvard system of stellar classification, you’ll find stars arranged in a precise brightness hierarchy:
- Supergiants (Class I) – The most luminous stars in the galaxy, often exceeding 60 solar masses, these behemoths eventually end their lives as supernovae.
- Giants and Bright Giants (Classes II & III) – Stars that have evolved beyond the main sequence, expanding as they exhaust their core hydrogen.
- Main Sequence Stars (Class V) – Including our Sun, these stars actively fuse hydrogen into helium.
This brightness classification is important for mapping stars on the Hertzsprung-Russell Diagram, providing valuable insights into stellar evolution and helping you understand a star’s position in its life cycle.
Main Sequence to Supergiants
Stars march through distinct evolutionary stages, each captured by a specific luminosity class in the Harvard classification system. When you examine a star’s classification, you’re seeing both its spectral type and evolutionary status.
Main sequence stars (class V) represent stellar stability, actively fusing hydrogen in their cores. These dwarfs form the backbone of the Harvard system, establishing a baseline for comparing stellar brightness.
As stars evolve, they expand into giants (classes III and II), having exhausted their core hydrogen.
The most spectacular stars in the classification are supergiants (class I), like Rigel and Betelgeuse, which showcase extraordinary luminosity and size.
From Blue Giants to Red Dwarfs: The Spectrum of Star Types
Every twinkling point of light in the night sky belongs somewhere on the Harvard classification system‘s elegant spectrum. This stellar classification organizes stars from the scorching Type O blue giants with surface temperatures exceeding 25,000 K to the cool Type M red dwarfs at around 3,000 K. The hydrogen spectral lines and other elements visible in a star’s light reveal its true nature.
Across this cosmic rainbow, you’ll find:
- Massive blue giants (Types O and B) – These rare, intensely hot stars can exceed 60 solar masses and dominate their stellar neighborhoods.
- Medium-temperature stars (Types A, F, and G) – Including our Sun (G2 V), showing prominent calcium and metal lines.
- Abundant red dwarfs (Type M) – Comprising 76% of main-sequence stars, with famous examples like Betelgeuse.
How Astronomers Use Stellar Classification for Research
When peering into the cosmos, astronomers rely on the Harvard classification system as their fundamental research framework.
You’ll find researchers using spectral types from O to M to quickly determine stellar temperature and composition, while luminosity classes help identify whether a star is on the main sequence, a giant, or a supergiant.
This classification becomes especially powerful when creating Hertzsprung-Russell diagrams, where you can visualize relationships between temperature and brightness across different stellar populations.
By plotting these characteristics, astronomers track evolution stages from birth to death for various star types.
The Harvard star classification also helps identify peculiar stars like carbon stars and Wolf-Rayet stars that don’t fit standard patterns, revealing fascinating outliers in stellar development and providing vital data about our universe’s diverse stellar inhabitants.
Modern Extensions to the Classical Harvard System
While the traditional Harvard classification system served astronomers well for decades, the universe continuously reveals stellar objects that defy simple categorization.
The system has evolved to accommodate these discoveries through several significant extensions:
- New spectral types L, T, and Y now classify brown dwarfs based on decreasing temperatures and unique spectral characteristics, expanding the Harvard star classification beyond main sequence stars.
- The Morgan-Keenan system introduced luminosity classes alongside spectral types, creating a two-dimensional approach to stellar categorization that provides greater precision in identifying a star’s evolutionary state.
- Specialized classifications like Wolf-Rayet stars and notation for peculiar features using lowercase letters allow astronomers to document unusual absorption profiles or emission lines previously difficult to categorize.
Advanced spectroscopic techniques continue driving these refinements, enhancing our understanding of stellar physics.
Practical Applications for Amateur Stargazers
Although professional astronomers rely on the Harvard classification system for sophisticated research, amateur stargazers can benefit tremendously from understanding this stellar taxonomy in their nighttime pursuits. You’ll enhance your observational experience by identifying a star’s temperature and luminosity through its spectral type (O, B, A, F, G, K, M).
| Spectral Type | Key Features | Amateur Benefits |
|---|---|---|
| O, B (Hot) | Blue giants | Prime astrophotography targets |
| A, F (Warm) | White stars | Easy identification in clusters |
| G, K (Moderate) | Yellow/orange | Similar to our Sun (G2) |
| M (Cool) | Red dwarfs | Numerous stellar evolution examples |
When you understand star classification, you’ll contribute more meaningfully to community discussions, comparing objects like our G2 Sun to distant stars, and appreciating stellar evolution as you observe the night sky’s diverse stellar population.
Frequently Asked Questions
Why Is Star Classification Important?
Star classification helps you understand stellar properties like temperature and luminosity. It’s crucial for tracking stellar evolution, identifying star populations, and investigating their potential for hosting planets – all essential for astrophysical research.
What Is the Harvard System of Star Classification?
The Harvard system classifies stars using letters O, B, A, F, G, K, and M based on their spectra and temperature. You’ll find it includes numeric subdivisions (0-9) and was pioneered by Annie Jump Cannon.
What Is the Significance of the Stellar Spectrum?
Stellar spectra reveal a star’s chemical composition, temperature, and ionization state through absorption lines. You’ll find they’re essential for classifying stars, understanding their evolution, and studying stellar atmospheres and physical conditions.
What Does the Spectral Class Tell Us About a Star?
Spectral class tells you a star’s surface temperature, color, chemical composition, and evolutionary stage. You’ll learn if it’s hot like O-class stars or cooler like M-class, helping determine its position on the Hertzsprung-Russell Diagram.
In Summary
When you look up at the night sky, you’re seeing the Harvard classification in action. It’s not just a sequence of letters (OBAFGKM) but a fundamental tool that’s revealed our understanding of stellar evolution. You’ll find this system underpinning everything from research telescopes to backyard astronomy. By organizing stars by temperature and properties, it’s given us the universal language to decode our cosmic neighborhood.


Leave a Reply