Astronomers classify galaxies through multiple techniques from Earth. You’ll use visual inspection to categorize them as spiral, elliptical, or irregular based on their morphology. Spectrum analysis reveals chemical composition and star formation rates, while brightness measurements and color indices provide insights into a galaxy’s age and activity. For precise classification, redshift data helps determine distances while multi-wavelength observations capture features invisible to the naked eye. Modern machine learning algorithms can enhance these traditional methods tremendously.
Visual Classification Systems for Galaxies
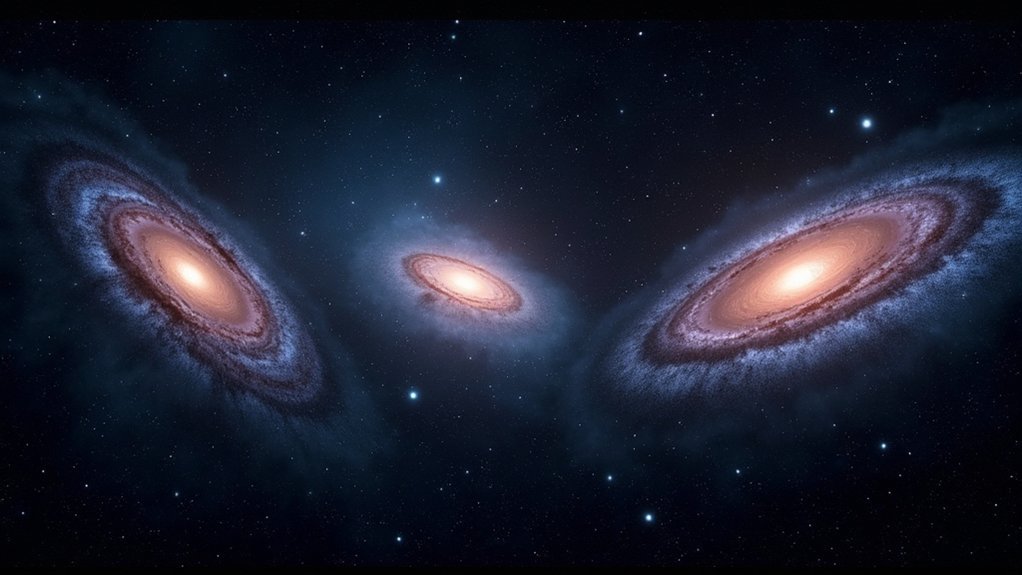
When astronomers observe the night sky, they classify galaxies into three primary categories: spiral, elliptical, and irregular. The Hubble Tuning Fork diagram serves as the foundational tool for this visual classification system, organizing galaxies based on their morphological features.
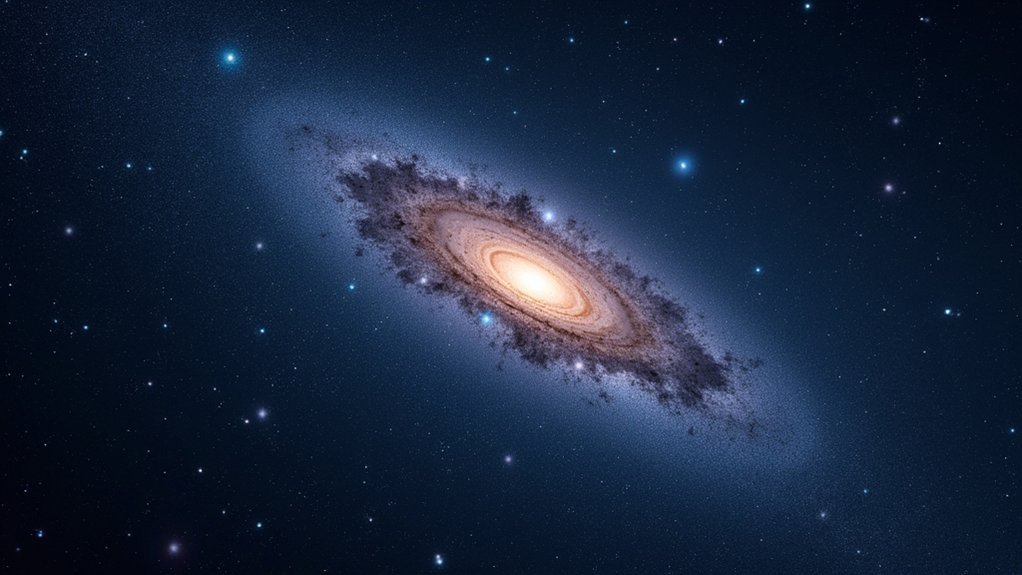
You’ll find spiral galaxies, comprising about 77% of all observed galaxies, easily identifiable by their distinctive arms rotating outward from a central bulge.
Elliptical galaxies vary from nearly spherical to elongated shapes, while irregular galaxies (about 3% of all galaxies) lack defined structure and often contain active star formation regions.
Ellipticals range from spherical to elongated, while rare irregulars display chaotic structures rich with stellar nurseries.
To classify galaxies accurately, you’ll need to examine key features such as bulge prominence, spiral arm tightness, and overall symmetry.
Modern CCD imaging techniques greatly enhance this process by capturing details of size, luminosity, and structural characteristics.
Spectrum Analysis and Galaxy Identification
Three fundamental spectral properties reveal a galaxy’s true nature beyond what visual observation alone can tell you. When you examine the light from distant galaxies, the specific emission and absorption lines identify chemical composition, while their strength indicates temperature and density. You’ll find spiral galaxies showing strong emission lines from active star formation regions, whereas ellipticals display prominent absorption features.
| Spectral Feature | Galaxy Classification Indicator |
|---|---|
| Emission Lines | Spiral galaxies, star formation |
| Absorption Lines | Elliptical galaxies, older stars |
| Doppler Shifts | Galaxy motion and dynamics |
| Element Ratios | Age and evolutionary stage |
Using spectrum analysis, you can determine a galaxy’s stellar populations by plotting data on Hertzsprung-Russell diagrams. These spectroscopic signatures, combined with Doppler shifts revealing motion, provide definitive classification of galaxy types even when visual identification proves challenging.
Measuring Galaxy Brightness and Luminosity
Beyond spectral properties, a galaxy’s brightness reveals its fundamental characteristics and evolutionary stage. When you’re examining galaxies, understanding the relationship between apparent brightness and true luminosity becomes essential for accurate classification.
- You’ll need large apertures to counteract diminishing light intensity toward galaxy edges.
- Apparent brightness measurements must be converted using distance calculations to determine true luminosity.
- Light distribution models help you calculate total brightness by accounting for varying emission across the galaxy.
- Giant elliptical galaxies can be 10 times brighter than our Sun, while satellite galaxies often appear dimmer.
- Luminosity data directly impacts how you’ll classify galaxies, revealing the relationship between size and stellar population.
This brightness-distance relationship provides critical insights into galactic structure and evolution that complement spectroscopic data.
Redshift Techniques for Galaxy Distance
The precise measurement of galaxy distances forms the backbone of modern cosmology, with redshift standing as your most powerful tool in this quest. When you analyze a galaxy’s spectrum, you’re calculating the redshift value (z) by measuring how much its light has stretched toward the red end of the spectrum.
| Redshift Value (z) | What It Tells You | Application |
|---|---|---|
| Low (z < 0.2) | Nearby galaxies | Local universe mapping |
| Medium (0.2 < z < 1) | Intermediate distances | Galaxy evolution studies |
| High (z > 1) | Early universe objects | Cosmic expansion research |
You’ll find that Hubble’s Law connects these redshift measurements directly to distance, forming a vital rung in the cosmic distance ladder. By compiling redshift data from multiple galaxies, you’re contributing to our understanding of the universe’s large-scale structure.
The Role of Standard Candles in Classification
While redshift measurements provide key distance information, standard candles offer you an independent method for gauging galaxy distances that greatly impacts classification efforts.
These reliable brightness references help you accurately determine how far galaxies are from Earth.
- Cepheid variables serve as excellent standard candles because their pulsation periods directly correlate with their luminosity.
- Type Ia supernovae provide consistent peak brightness, making them ideal for measuring distances to more remote galaxies.
- When you measure distances accurately, you can better distinguish between spiral, elliptical, and irregular galaxy types.
- Standard candles help you assess a galaxy’s true luminosity and physical size, vital parameters for classification.
- By understanding distances through standard candles, you’ll gain valuable context about galactic evolutionary history and characteristics.
Radio Wave Observations of Distant Galaxies
Radio wave observations provide you with a powerful window into distant galaxies that optical telescopes simply can’t match.
By detecting the 21-cm line emitted by neutral hydrogen gas, you’ll gain essential insights into star formation regions and galaxy structure that remain hidden in visible light.
You can measure rotational velocities of galaxies through radio emissions, helping you determine their mass and understand the Tully-Fisher relation.
Unlike optical observations, radio waves penetrate dust clouds, offering a clearer view of galaxy formation and interactions.
When you analyze radio data, you’ll identify active galactic nuclei powered by supermassive black holes.
These observations reveal the distribution and dynamics of hydrogen gas throughout galaxies, creating detailed maps that enhance your understanding of cosmic evolution without being limited by optical obscuration.
Star Formation Rates as Classification Markers
You’ll find that star formation rates provide essential insights when analyzing active regions within different galaxy types.
By measuring the ratio of blue light (indicating young stars) to red light (indicating older stellar populations), you can quickly determine whether a galaxy is actively forming stars or has become dormant.
These blue-to-red ratios serve as reliable classification markers, helping you distinguish between spiral galaxies with high star formation rates and elliptical galaxies where star formation has largely ceased.
Active Region Analysis
Because stars are born in specific regions of galaxies, measuring star formation rates provides astronomers with a powerful tool for galaxy classification.
You’ll find that analyzing these active regions reveals essential information about galaxy types and their evolutionary stages.
- Identify spiral galaxies by their high star formation rates within distinctive spiral arms
- Use spectroscopic observations to detect emission lines from young, hot stars and H II regions
- Calculate specific star formation rate (sSFR) to distinguish between quiescent galaxies and starburst galaxies (>10^-10 yr^-1)
- Examine galaxy morphology to correlate structure with star-forming activity
- Measure the luminosity of ionized hydrogen regions to quantify recent star formation
This approach lets you classify galaxies based on their current stellar nurseries, offering insights into both present conditions and evolutionary history.
Blue-to-Red Light Ratios
Building upon our active region analysis, the blue-to-red light ratio offers a more quantitative approach to galaxy classification. When you measure this ratio, you’re fundamentally quantifying a galaxy’s star formation rate—higher ratios indicate younger, hotter stars actively forming in the galaxy.
To determine this vital parameter, you’ll need to analyze the spectral energy distribution through photometric measurements in different wavelength bands. Calculate the color index (typically B-R) to precisely categorize the galaxy’s type. A value markedly above one suggests a starburst galaxy with intense star formation, while ratios near or below one point to elliptical or passive galaxies with older stellar populations.
This method transforms qualitative observations into numerical data, allowing you to classify galaxies based on their current stellar activity rather than just morphology.
Hubble Sequence and Modern Extensions
When astronomers classify galaxies, they typically rely on the Hubble Sequence—a fundamental classification system developed by Edwin Hubble in the 1920s. This morphological classification organizes galaxy types into three primary categories: elliptical, spiral, and irregular. The famous Tuning Fork diagram visualizes these relationships, with spiral galaxies branching from ellipticals.
- Elliptical galaxies range from E0 (nearly spherical) to E7 (highly elongated)
- Spiral galaxies divide into normal spirals (S) and barred spirals (SB)
- Irregular galaxies sit outside the main sequence due to their undefined structures
- Modern extensions incorporate color data and star formation rates
- Advanced observational data has expanded the system to include dwarf and peculiar galaxies
Today’s technologies like the Hubble Space Telescope continue to refine this system, providing you with a more thorough framework for understanding galaxy evolution and structure.
Galaxy Size and Morphology Measurement
When measuring galaxy types, you’ll need to assess radial diameter by determining where galactic light fades into the background, typically at thresholds of several kiloparsecs for dwarf galaxies and up to 200 kiloparsecs for giant ellipticals.
Angular size techniques convert your observations to actual physical dimensions using distance calculations and appropriate telescope apertures or CCD imaging.
You can enhance measurement accuracy by applying light distribution models that account for how luminosity diminishes toward a galaxy’s edges, critical for distinguishing between spiral, elliptical, and irregular morphologies.
Radial Diameter Assessment
Three fundamental techniques in modern astronomy allow precise measurement of galaxy radial diameters, with photometric analysis standing as the most widely adopted method.
When you’re studying galaxies, understanding their size reveals significant information about their formation and evolution.
- You’ll find that photometric techniques measure radial diameter by summing total light output, defining the boundary where half the galaxy’s light is enclosed.
- Different galaxy types exhibit distinctive size ranges—dwarf ellipticals span just a few kiloparsecs while giant ellipticals can exceed 200 kiloparsecs.
- Light travels so slowly relative to cosmic scales that it takes over 500,000 years to cross the largest galaxies.
- To measure distances accurately, you’ll need to determine the galaxy’s redshift and apply cosmological models.
- Your assessment methods will vary by galaxy type, with spiral galaxies typically ranging from 10-50 kiloparsecs in diameter.
Angular Size Techniques
Accurately measuring a galaxy’s angular size reveals essential information about its physical dimensions and classification while requiring only basic observational equipment.
When you capture images using CCD technology, you’re documenting how large a galaxy appears from Earth in angular units like arcseconds or arcminutes.
To determine a galaxy’s actual physical size, apply this simple formula: physical size = distance × angular size (in radians). This calculation helps you measure distances between Earth and distant galaxies.
Through these observational techniques, you’ll notice dwarf galaxies typically span just a few arcminutes, while larger spiral galaxies can extend several arcminutes or even degrees.
The angular measurements you collect also reveal morphological details—whether you’re observing a spiral, elliptical, or irregular galaxy—providing essential data for proper galaxy classification and structural analysis.
Active Galactic Nuclei Detection Methods
Identifying Active Galactic Nuclei (AGN) requires multiple observational techniques that reveal their unique energy signatures.
You’ll need specialized equipment and analysis methods to detect these powerful cosmic phenomena driven by supermassive black holes.
- Analyze emission spectra for strong ionized element lines and broad emission features that indicate gas moving at high velocities.
- Monitor luminosity variations over time, as AGN brightness often changes on timescales from days to months.
- Utilize X-ray observations from space telescopes to detect high-energy radiation characteristic of accreting black holes.
- Employ radio telescopes to identify radio-loud AGN with their distinctive jets and extended lobes.
- Look for unusually high energy outputs from galactic centers that can’t be explained by stellar processes alone.
Multi-wavelength Observation Techniques
To fully understand the complex nature of galaxies, you’ll need to observe them across multiple wavelengths of the electromagnetic spectrum. Different wavelengths reveal distinct galaxy features—radio waves highlight star formation regions, while X-rays expose hot gas in galaxy clusters.
When classifying galaxy types, combine data from various wavelengths. The Hubble Space Telescope captures visible light images showing morphology, while infrared observations penetrate dust clouds to reveal obscured star formation. This thorough approach helps you differentiate between spiral, elliptical, and irregular galaxies with greater accuracy.
For distance measurements, multi-wavelength observations enhance the reliability of standard candles like supernovae. By analyzing a galaxy’s emissions across the spectrum, you’ll gather complementary data that refines distance calculations and improves your understanding of galactic structures and evolutionary processes.
Machine Learning Approaches to Galaxy Classification
While astronomers traditionally classified galaxies through visual inspection, machine learning algorithms now revolutionize this process with unprecedented speed and accuracy.
You’ll find that convolutional neural networks (CNNs) can analyze vast datasets from telescopes like Hubble, achieving classification accuracies above 90%.
- Machine learning models can automatically categorize galaxies as spiral, elliptical, or irregular types after training on labeled datasets.
- These algorithms extract features from galaxy morphology and light distribution patterns.
- You can process thousands of galaxy images in hours rather than weeks or months.
- The automated galaxy classification reveals subtle features human classifiers might miss.
- These techniques have surpassed traditional manual methods, making large-scale astronomical surveys more efficient.
Frequently Asked Questions
How Do We Know How Far Other Galaxies Are From Earth?
You can determine other galaxies’ distances using redshift measurements through Hubble’s Law, observing standard candles like Type 1a supernovae and Cepheid variables, and applying the cosmic distance ladder for different distance scales.
How Do You Measure the Properties of Galaxies?
You’ll measure galaxy properties through luminosity (using distance and brightness data), size (calculating light distribution), stellar content (observations and modeling), and mass (using mass-to-luminosity ratios). Standard candles help determine accurate distances for these measurements.
How Do You Measure the Size of a Galaxy?
You’ll measure a galaxy’s size by capturing CCD images and calculating its total light emission. You can determine its dimensions in kiloparsecs by measuring the aperture containing half its total light against background space.
How Do Scientists Measure Our Galaxy?
Scientists measure our galaxy using parallax to determine distances, analyzing star distributions through photometry, tracking stellar motions, studying Cepheid variables, and using radio astronomy to map cosmic structures you can’t see visually.
In Summary
You’ve now explored the many ways astronomers classify galaxies from Earth, from visual inspection to sophisticated machine learning algorithms. Whether you’re using redshift data, spectral analysis, or multi-wavelength observations, you can identify galaxy types with increasing precision. As technology advances, you’ll find it easier to contribute to this field, even as an amateur astronomer with modest equipment. The universe’s diversity awaits your classification!


Leave a Reply